Rastin Rastgoufard, Ph.D.
Unocity Innovations Inc
August 11, 2021
Hurricane Katrina devastated New Orleans 16 years ago arriving in August of 2005. In this post we will examine the forecasts from the storm in the days leading up to and including landfall. What information could we have known at the time? How would our decision making change throughout the trajectory of the storm? HurrD has a database of historical storms, and we will be using it for our analysis.
To not over-promise and to avoid extreme clickbait, there is nothing in HurrD or in NOAA's forecasts that could possibly have predicted the levees breaking in New Orleans. In my personal experience, I vividly remember watching the storm's arrival on TV on a Monday morning, seeing that there was a lot of wind damage but nothing out of the ordinary for a storm its size, and preparing to return back from evacuation on Tuesday morning. It was only Tuesday morning that we saw on the news how much water was still in the city and continuing to rise.
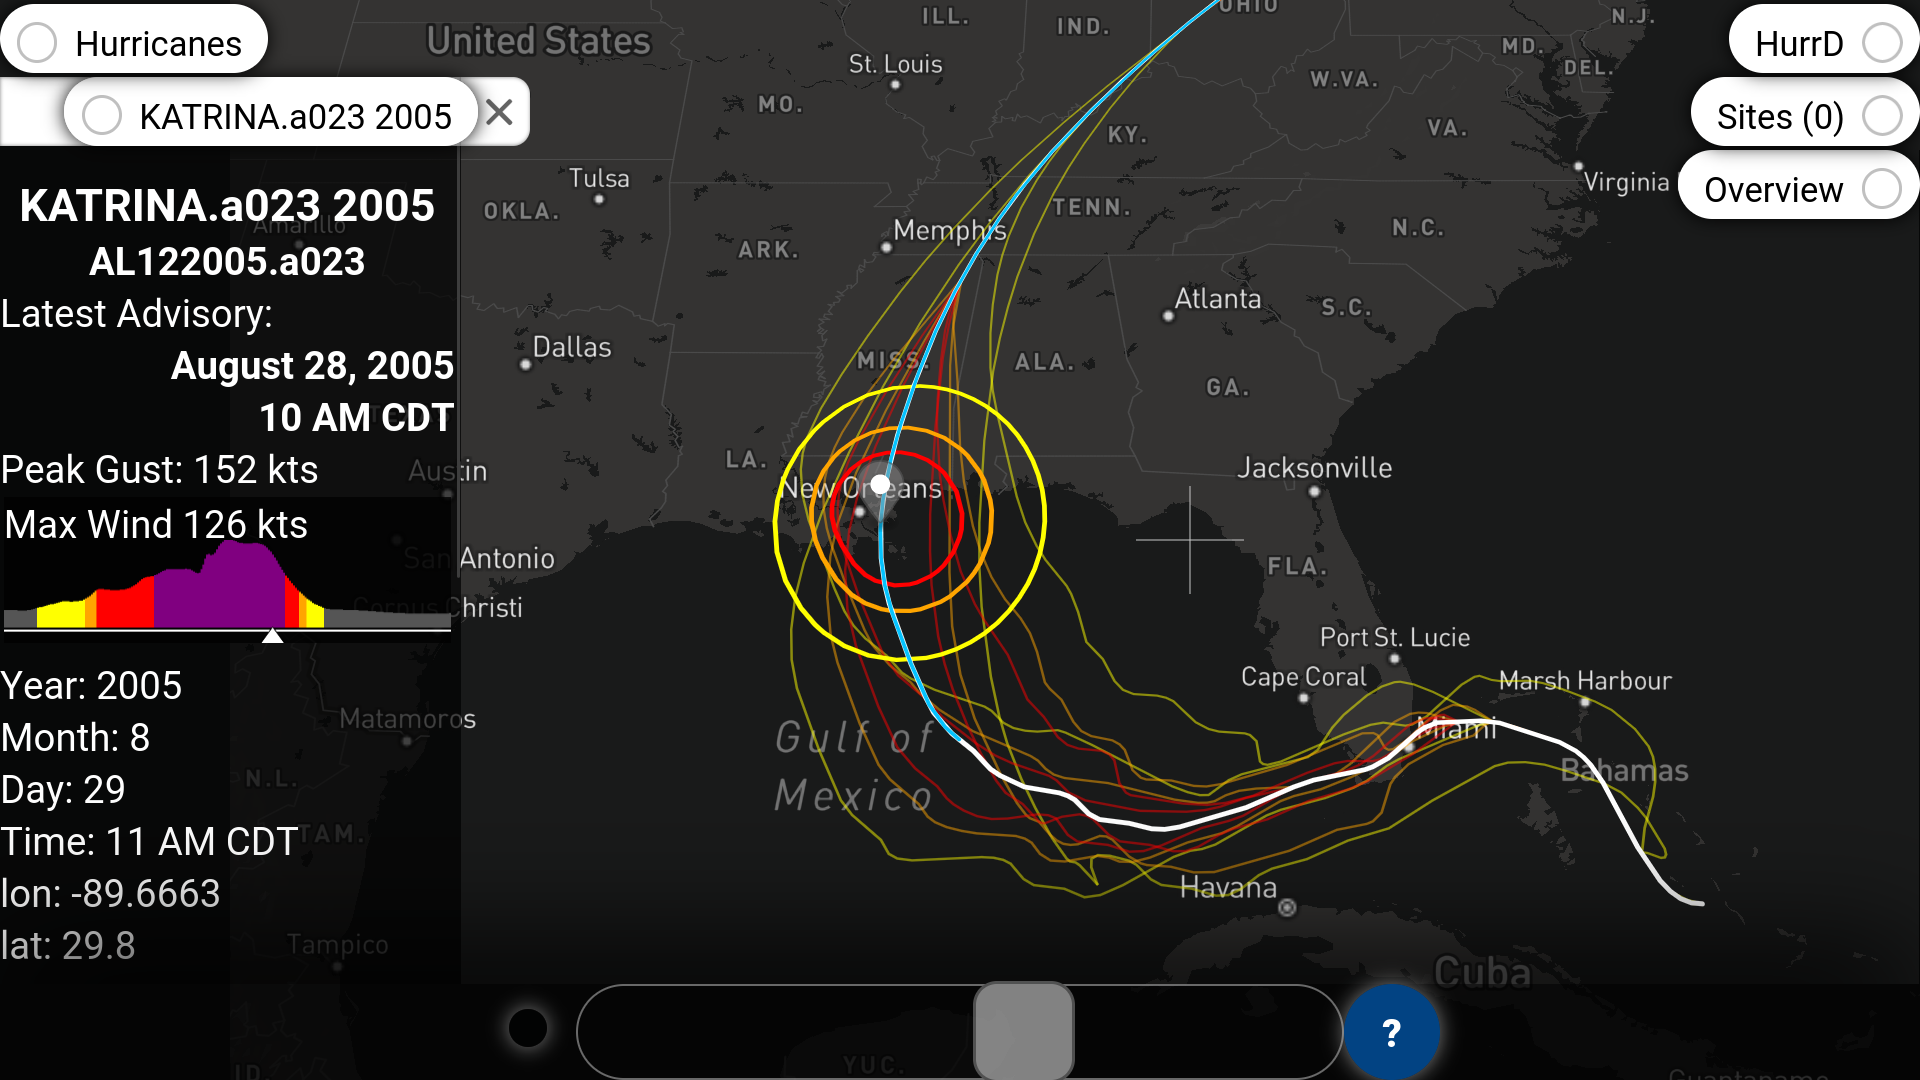
Atmospheric air movement is incredibly complicated to measure and model precisely, so several approximations are needed, especially in the case of tropical storms and hurricanes. Hurricanes are assumed to have a center around which winds circulate, and winds closer to the center have higher speeds than those far away. Take a look at this HurrD visualization of Katrina from August 28, 2005. The solid white line shows the trajectory that the center took over its lifespan, and the blue line continuation shows the forecasted trajectory that it would take in the following few days.
The yellow, orange, and red lines alongside the white and blue trajectory lines show the boundaries of 34kts winds, 50kts winds, and 64kts winds, respectively. (That's about 39mph, 57mph, and 74mph.) At any point in time, the center of the storm is somewhere along that trajectory line, and its wind fields span out and touch the colored wind lines.
The top image shows the storm's actual and forecast trajectories along with the wind boundaries, and the lower image shows the exact same information except focused on the time instant when the center was forecast to be closest to New Orleans. The heavy yellow, orange, and red rings show the contours of the storm's wind speeds. The colors again represent 34, 50, and 64kts, but with the contours present, it is very easy to see the size of the storm. Also, a tiny gray map marker icon indicates the location of the center of the storm.
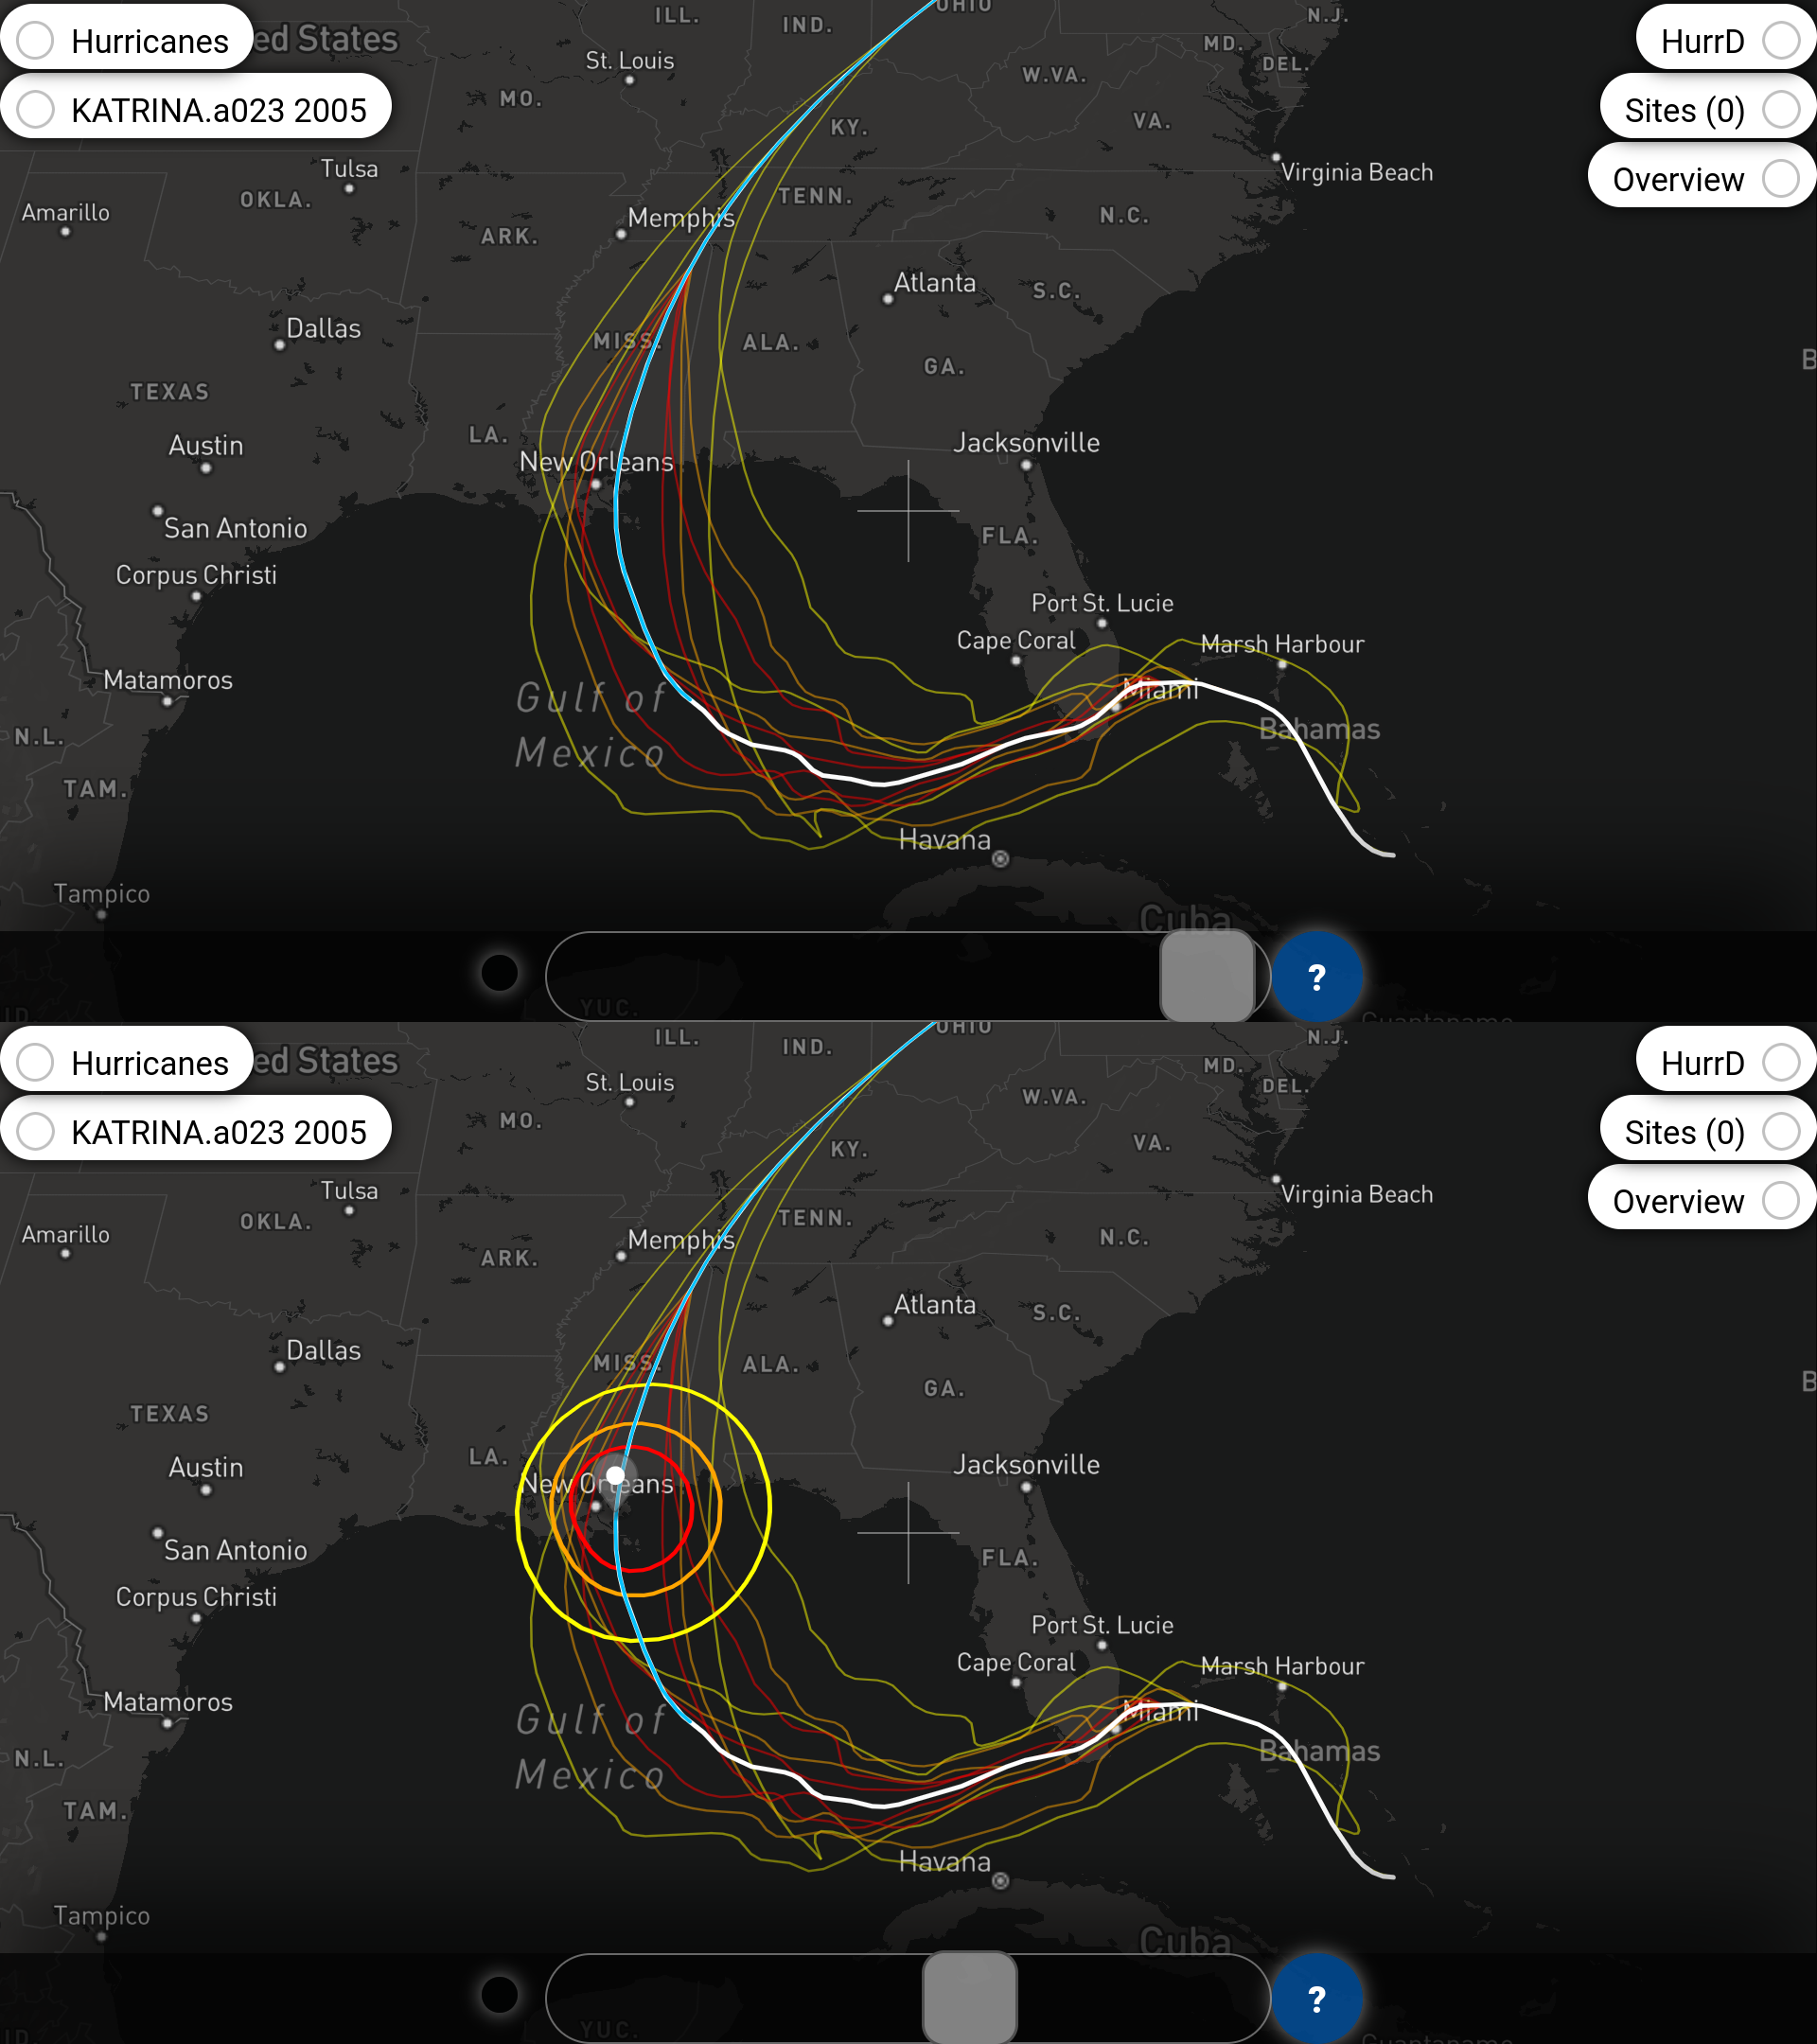
As can be seen in the visualizations, the red contour, representing 64kts or about 75mph, was huge. Can you imagine driving down the highway at 75 miles per hour without a windshield?!? Everything inside of that red ring, the ring that is almost the size of the entire state of Louisiana, felt that much wind. That's a lot of force. That's so much that even robust oak trees can be uprooted from the ground.
In HurrD, the blue lines represent forecast trajectories, but forecasts are not constant and instead get updated and refined as time passes. If it is suspected that a storm will make landfall on the 29th of a month, then the prediction of exactly where it will hit is much more accurate on the 28th (one day before) compared to the 26th (three days before). Always the farther out a prediction is made, the more uncertainty it will have. The following animated image shows a slideshow of HurrD's visualizations of Katrina given time-limited information. On one step, information is limited to what was known as of 10am on August 26th. The next step shows 10am on August 27. Then August 28, August 29, and August 30. In HurrD's user interface, the timing information can be seen by looking at the piece of information labeled "Latest Advisory" in the panel on the left that shows detailed information about a specific storm.
Notice that immediately after passing over Florida on the 26th of August, the storm was expected to take a sharp detour and aim north to hit Alabama or Georgia. However, one day later, on the 27th, the forecast correctly predicted that it would strike very close to New Orleans.
It's interesting to watch the way the forecast's blue line gets refined into the actual storm trajectory's white line as the gif advances. Between the 26th, 27th, and 28th, the amount of red also increases significantly, indicating that the storm strengthened beyond its predictions.
These trajectories and forecasts are obtained directly from the National Oceanographic and Atmospheric Administration (NOAA), specifically its National Hurricane Center (NHC). Teams of scientists use satellite imagery and an enormous number of distributed sensors in order to feed a plethora of global weather simulation models, all of which get condensed down to a single "best" estimate. How good are these best estimates? That will be the topic of a future post. (Stay tuned!) Anecdotally, the forecasts from the NHC are as good as can be given the complexity of weather modeling. Over time as the world's computational power and statistical modeling tools improve, future forecasts will also improve.
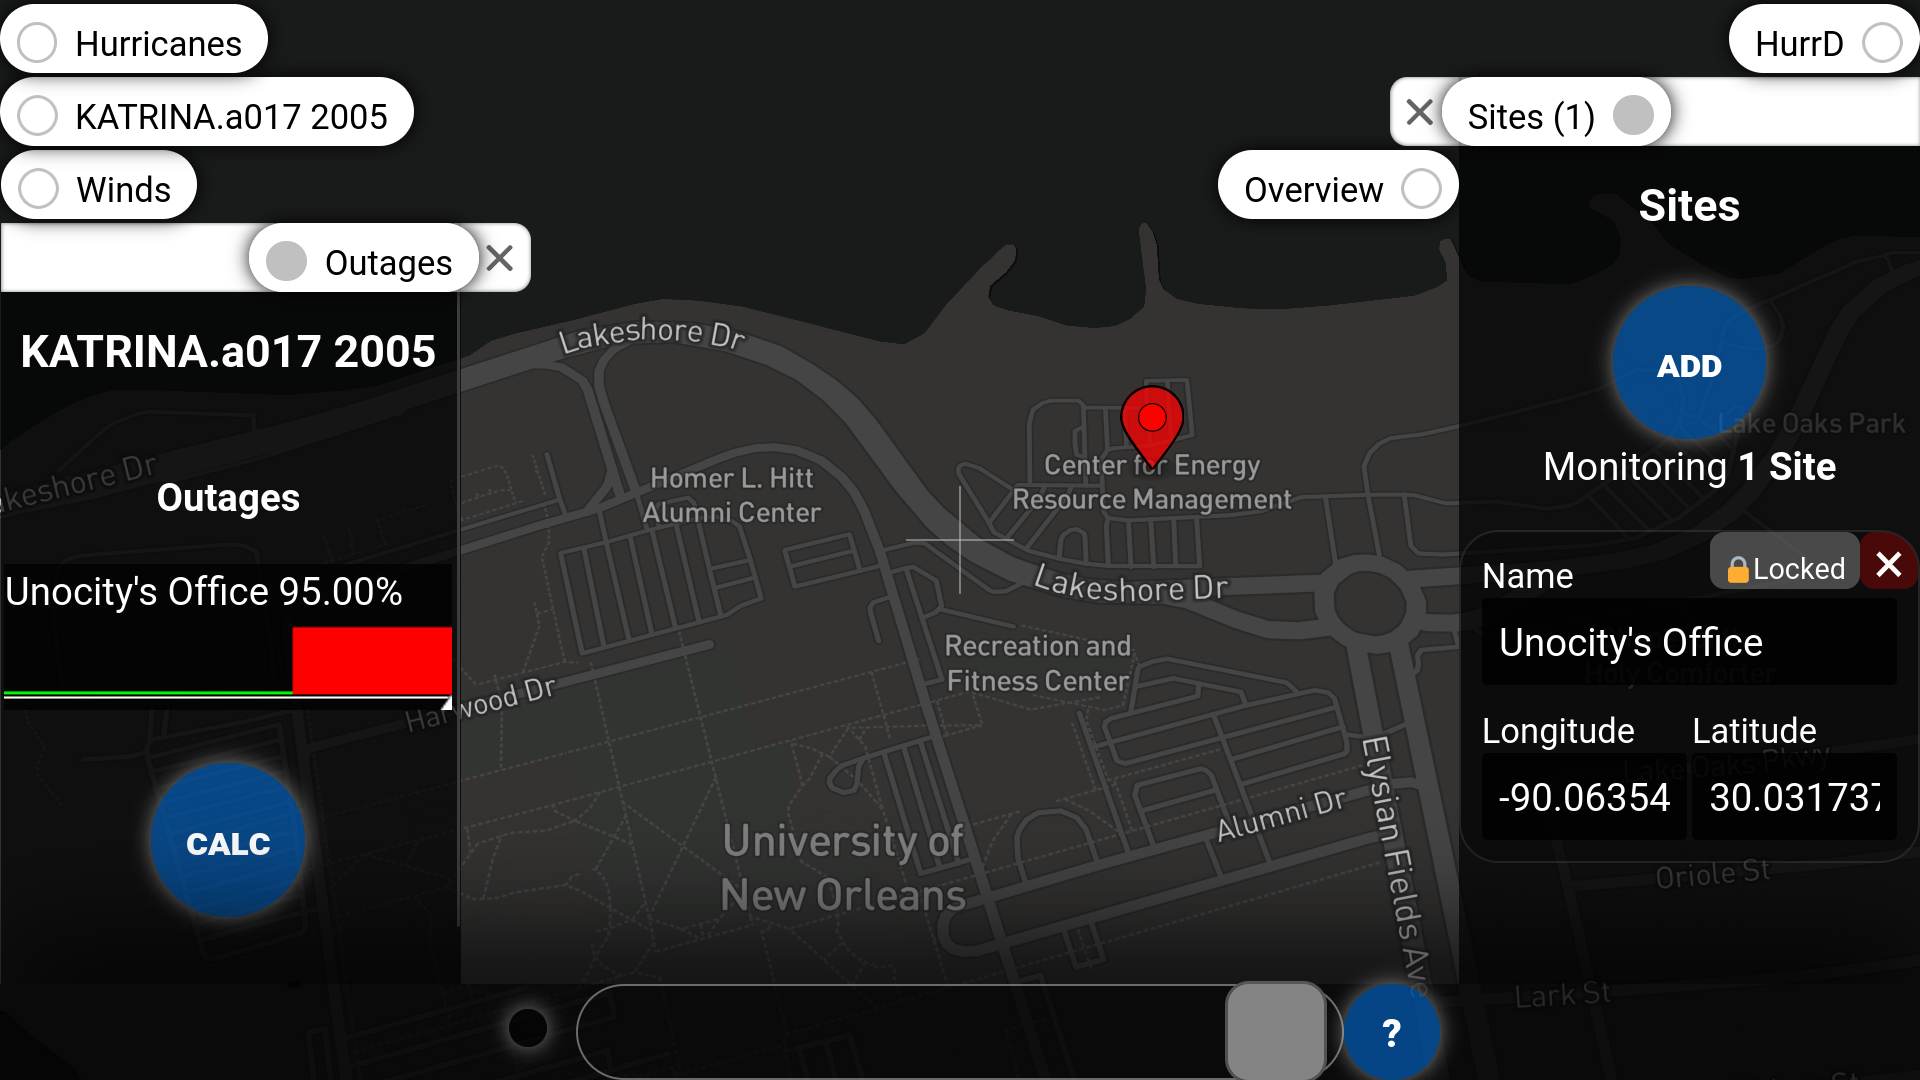
To find out the impact of a storm using HurrD, we need to select at least one site and one storm for performing analysis. Here we have a closeup of Unocity's office in New Orleans and have chosen advisory 017 from hurricane Katrina which was timestamped 10am on August 27, 2005, two full days before the storm made landfall. In HurrD's Outages tab, the CALC button starts simulating the hurricane while watching the sites. When it is finished, the site markers on the map get colored based on power outage severity, and a plot of outage probability vs time is shown in the Outages tab for each site. In this screenshot, we can see from the solid red color that Unocity's office was predicted to lose electricity with 95% probability.
Repeating the same exercise for advisories 012, 017, 023, 027, and the final advisory yields very similar results for Unocity's office. All of them except for Advisory 012 depict Unocity losing power with 95% probability. Advisory 012 is from three days before landfall and the forecast model had predicted that Katrina would strike Alabama or Georgia, not Louisiana. In the case of Advisory 012, Unocity's office shows a green marker with below 5% probability of power loss. The screenshot shows the trajectory of Advisory 012 (remember that the blue line is entirely forecast -- the storm itself was just barely past Florida at this time) along with the Outage vs Time plot on the left side. The right side shows an Overview of results for all of the advisories. From that panel it is clear that the only green dot corresponds to Advisory 012 and that Unocity was predicted to lose power in all other cases.

I remember a year after the storm seeing the building that now houses our office having almost all of its windows broken with a lot of water damage throughout, and the entire building needed heavy renovations in order to be functional again. Makes sense considering how close the building is to the path that Katrina took. The above results from HurrD, that Unocity's office was forecast to lose power with 95% probability, seem kind of obvious with the near direct hit.
We can easily repeat the analysis on as many sites as desired. Let's consider a number of airports, eight of them to be precise. From west to east, let's look at Lafayette LA, Baton Rouge LA, New Orleans LA, Jackson MS, Gulf Port MS, Biloxy MS, Pensacola FL, and Tallahassee FL. The animated gif here shows the same set of Katrina advisories timestamped one day apart beginning at 10am on August 26, three days before landfall, and ending 10am on August 30, the day after the storm.
Several interesting facts can be observed in the results from the eight airports. Baton Rouge was not in the direct path of the hurricane, but its marker was orange during all of the forecasts, indicating that it had a moderately high probability of losing power (in a tab not shown in the gif, the probability was calculated to be 73.6%). This must be because a large amount of Baton Rouge's electrical connectivity is towards its east side, and so when New Orleans is disconnected from the power system, Baton Rouge is impacted heavily and might become islanded. If you lived in Baton Rouge when Katrina was on its way and reliable electricity were a concern (due to needing air conditioning, medical apparatuses, or any host of other reasons), an evacuation slightly westward would have been a good idea.
Another very interesting result is that the storm kept growing and intensifying beyond what was forecast. Look closely at Mobile and Pensacola, both of which were colored yellow two days before landfall. One day after, on the 28th, the forecast and HurrD would have predicted Mobile to be solid red, and by the time the storm actually made landfall, even Pensacola was predicted to be solid red. Even though the snapshots in this analysis are exactly one day apart, actual forecast advisories are produced by the NHC every three to six hours. Because HurrD mirrors the NHC's forecasts and stays up to date within a couple of minutes, it is possible that people in Pensacola would have a limited but large-enough lead time to evacuate if power continuity were a strict requirement. (As mentioned previously, examining historical accuracy of storm trajectory forecasts will be the topic of a future post.)
So far, everything in this article has been centered on a single historical storm, albeit with varying amount of information to simulate what we might have seen had HurrD existing during the time of Katrina.
In the next part of this article, we will examine hurricane Zeta 2020 and Elsa 2021. Zeta struck New Orleans while we were in lockdown at the end of October 2020. And Elsa passed right next to Tampa Florida just a month ago in July 2021. For both, we will again analyze forecasts from one day, two days, and three days before landfall, but we also will take into consideration "what-if" scenarios that alter the storms' trajectories by shifting them a few miles east or west. These what-if scenarios allow us to make decisions even when faced with forecast modeling uncertainty.
Stay tuned for the next part of this article to be released soon.
----------
This article originally appeared at https://unocity.us/blog/examining-power-outages-three-days-in-advance-part1 on August 11, 2021.
Visit https://hurrd.ai for more details on HurrD and https://unocity.us to see Unocity's main website.
