Rastin Rastgoufard, Ph.D.
Unocity Innovations Inc
December 1, 2024
It's been a while since we wrote a technical article about HurrD! The app has changed a ton in that time. Two large updates have fundamentally made it much more useful and powerful.
1) HurrD is now available to you as an individual with one, two, or three sites/locations/addresses on a yearly subscription! One site is only $10 for a whole year. Check it out. https://hurrd.ai
2) As of 2023, HurrD can now predict how long your power will be out! We spent a lot of resources getting data and training models, and HurrD's predictions have been timely, insightful, and accurate.
The primary purpose of this article is to show precisely how the models have been doing in the real world. We're going to focus on one specific storm, Francine 2024, because we made predictions on the entire system, made them publicly available to everyone, and saw first-hand how accurate the models were.
My office near the lake in New Orleans was just east of where Francine's center passed. According to HurrD, this site was expected to lose power for 67 hours.
Figure 1 is a screenshot from HurrD that shows the power outage probability curve for my office. The x-axis is time and the y-axis is probability of not having power.
This specific prediction uses NOAA storm data up to 3pm UTC on September 12, 2024. In this case, HurrD predicted the probability of my office losing power at 70%, and if it goes out, it should be restored within 67 hours.
The 67 hours predicted outage duration corresponds to 8pm Central on September 14, 2024. At this time, the probability of a power outage at my office dropped below 10%.
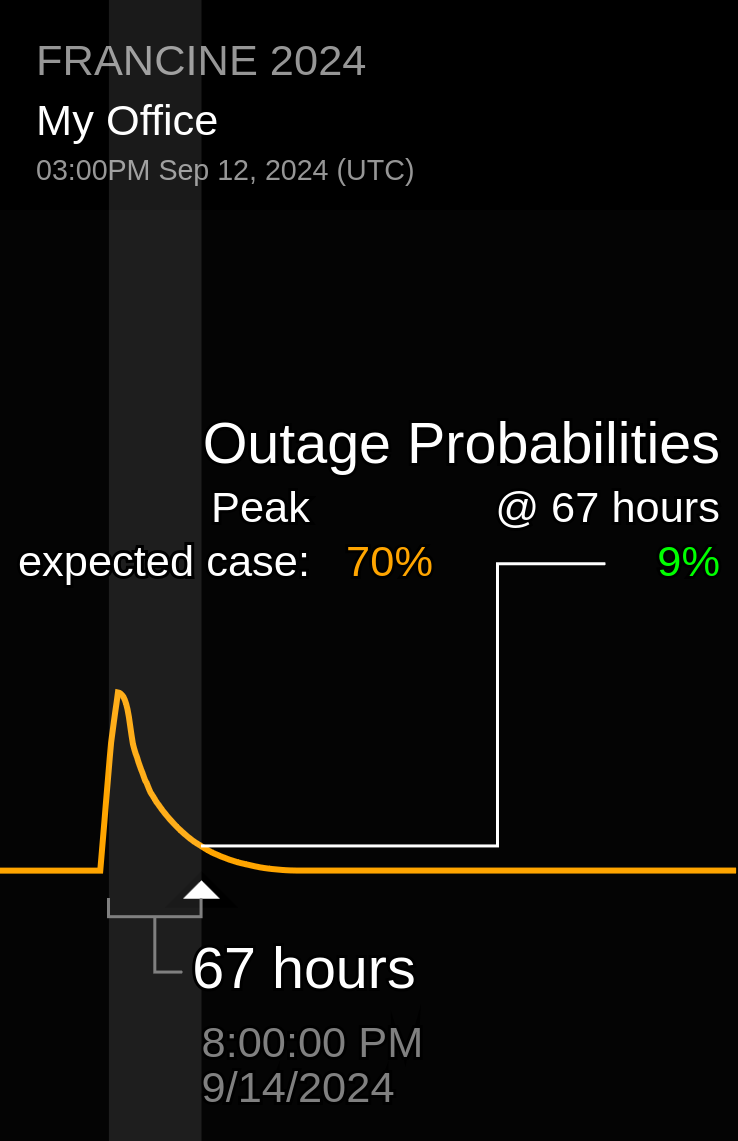 Figure 1
The same information can be seen in Figure 2, another screenshot from HurrD, this time showing the map. My office is the orange marker. The white line shows the path that Hurricane Francine took, and the yellow, orange, and red lines show the boundaries of its weak, medium, and strong winds.
The Outages panel on the left side of the image shows the same Outage Probability Curve as in Figure 1.
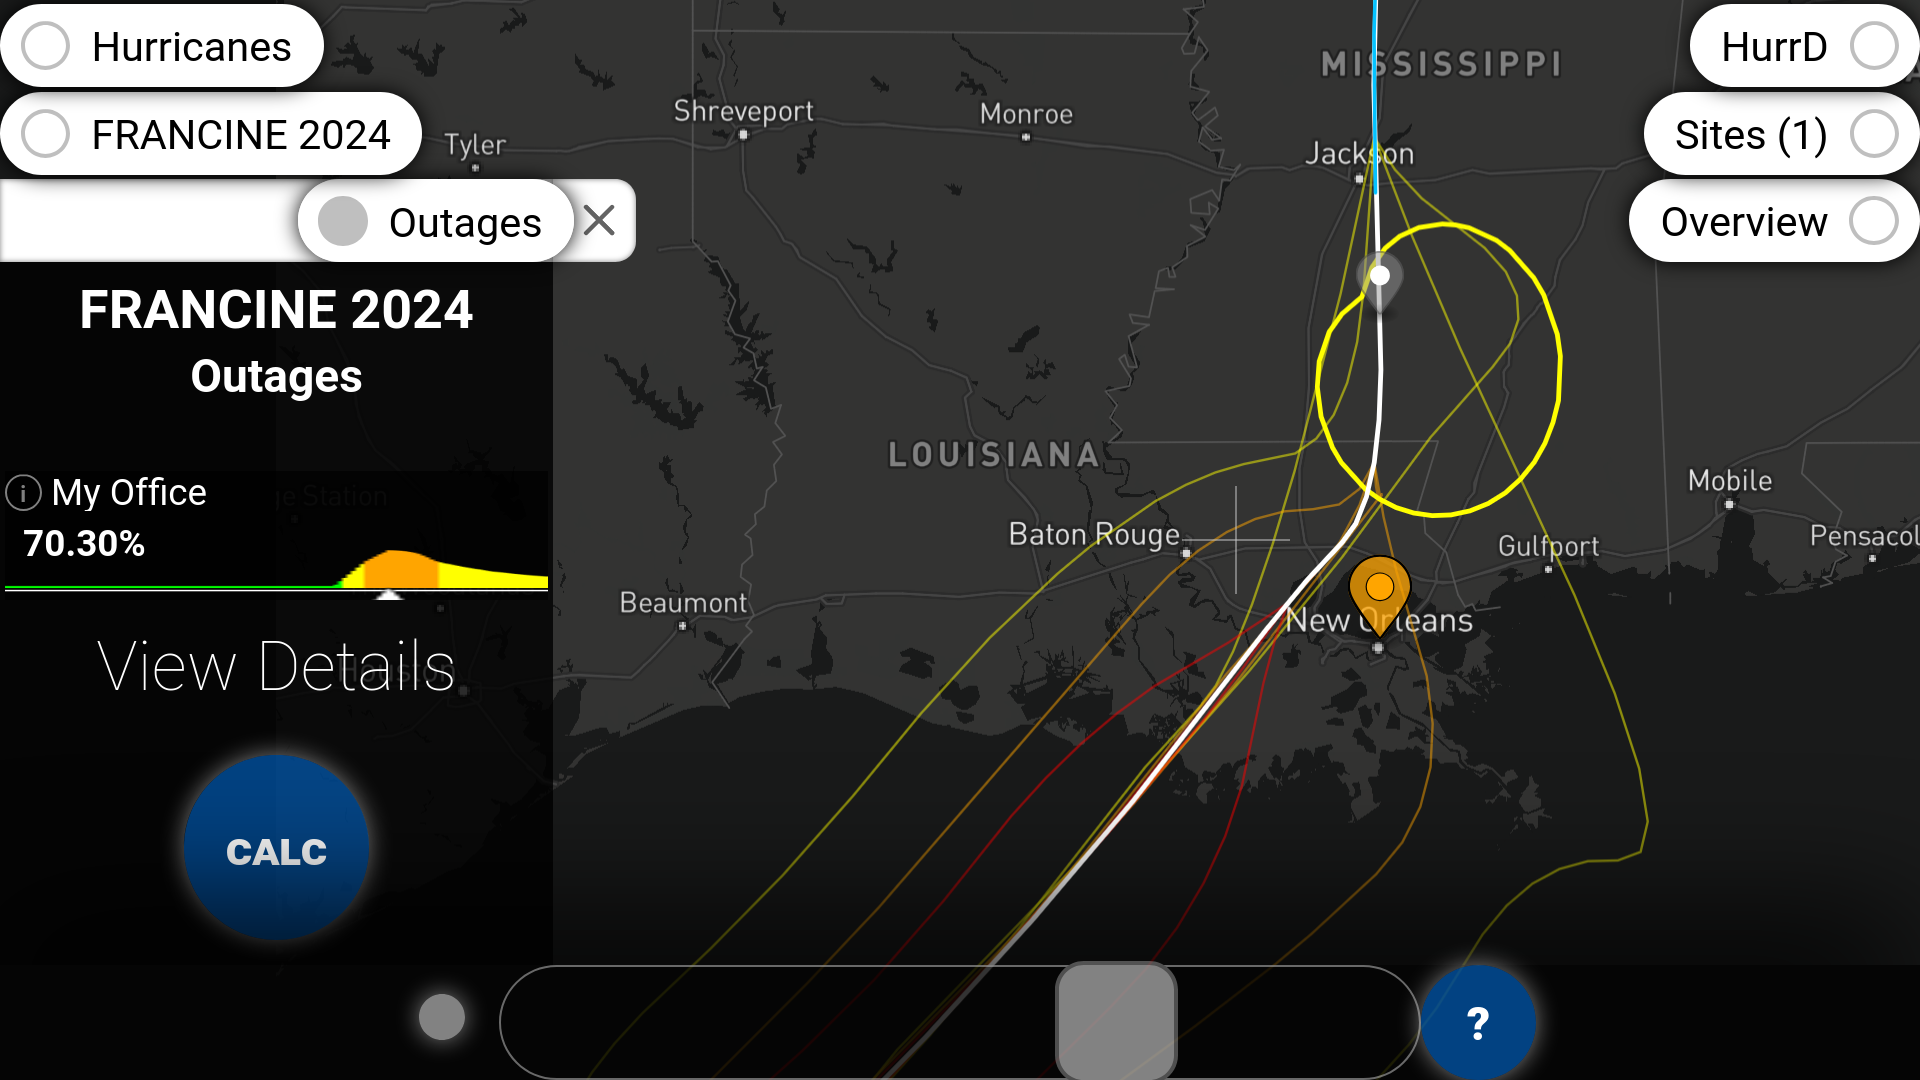 Figure 2
The detailed Outage Probability Curve of Figure 1 works well as a visualization when the number of sites is small, but it would take a lot of space to show that much information for many sites, as seen in Figure 3.
The Outages panel in Figure 3 shows half a dozen Outage Probability Curves on the screen, but the map has at least a couple dozen markers on it, each of which has a corresponding curve that is hidden behind a scrollbar in the Outages panel.
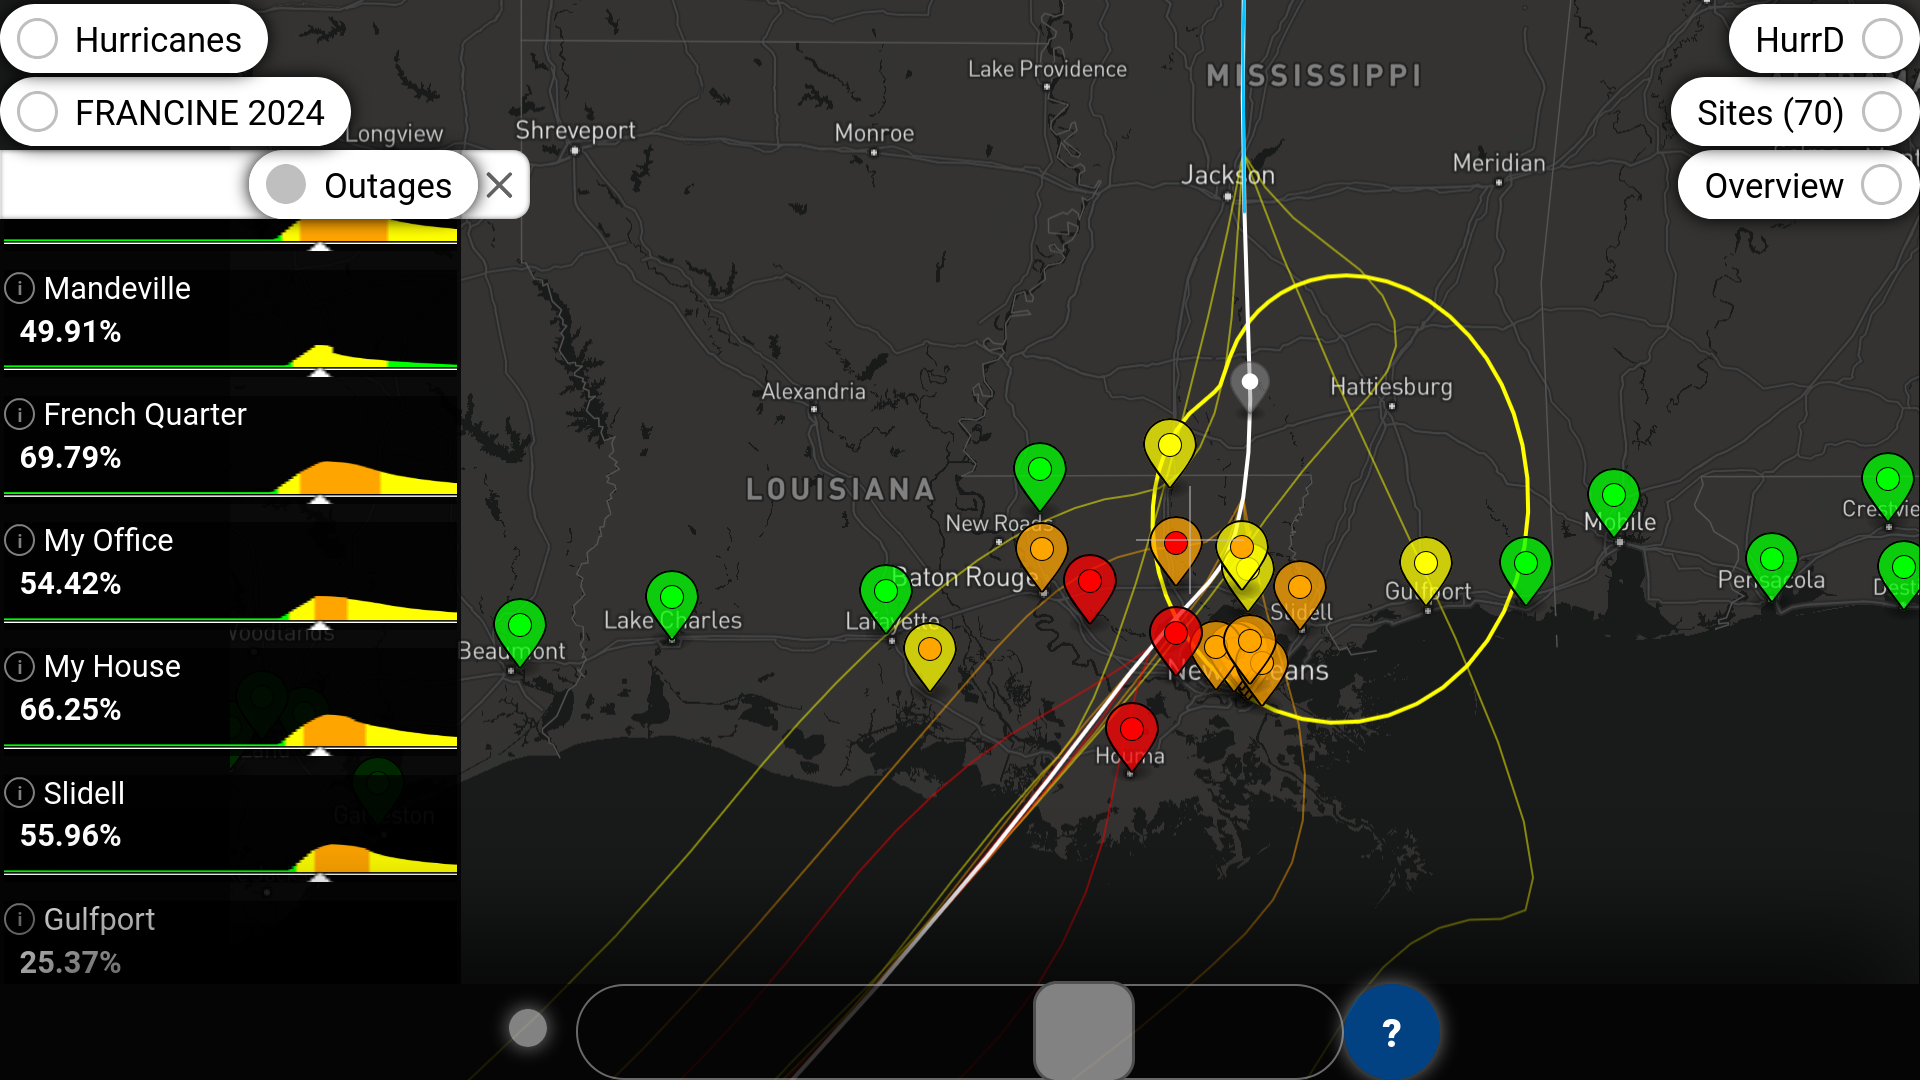 Figure 3
In actuality, the area shown in Figure 3 has thousands of locations where HurrD can make outage probability predictions. If we color each and every one of those locations based on the expected outage duration time, we get a system-wide map, an example of which is Figure 4.
 Figure 4
Hurricane Francine officially became a hurricane approximately at 10am Monday September 9. It started off as Atlantic storm SIX and was renamed to Francine as of NOAA's 4th forecast advisory.
In the earliest advisories, Francine was originally forecast to make landfall along the western half of Louisiana's gulf coast. Each successive advisory up to NOAA's 8th one had the storm's forecast shifting eastward little by little. Finally, around the 8th advisory at 10am on Tuesday September 10, the forecast track found consistency.
At each step along the way, HurrD provided system-wide outage duration predictions that detailed where and how long power would be out, assuming the hurricane followed the forecast track provided by NOAA. This sequence of predictions is collected into the animated gif of Figure 5.
 Figure 5
HurrD's prediction corresponding to NOAA's advisory #14 (shown in Figure 6) was particularly relevant as it was the first forecast advisory after the storm had made landfall. The storm's eye crossed Louisiana's coastline with a northeastern trajectory around 5pm on Wednesday September 11, and by 10pm, the time of advisory #14, the storm's eye was directly west of New Orleans.
Figure 6
After the storm passed through most of Louisiana, conditions were safe enough for Entergy to visually inspect all of the affected areas and to provide estimated restoration times for those parishes. In the morning of Thursday September 12, Entergy released their parish-by-parish restoration time estimates which we have plotted (Figure 7) on our own map to provide consistent scales and colors in order to allow more direct comparison.
According to Entergy, the "estimated restoration times are when 90% of a given parish are anticipated to be restored." This 90% restoration threshold feels appropriate to us too as you may remember from Figure 1 where the outage duration is determined by the number of hours that the outage probability exceeds 10%.
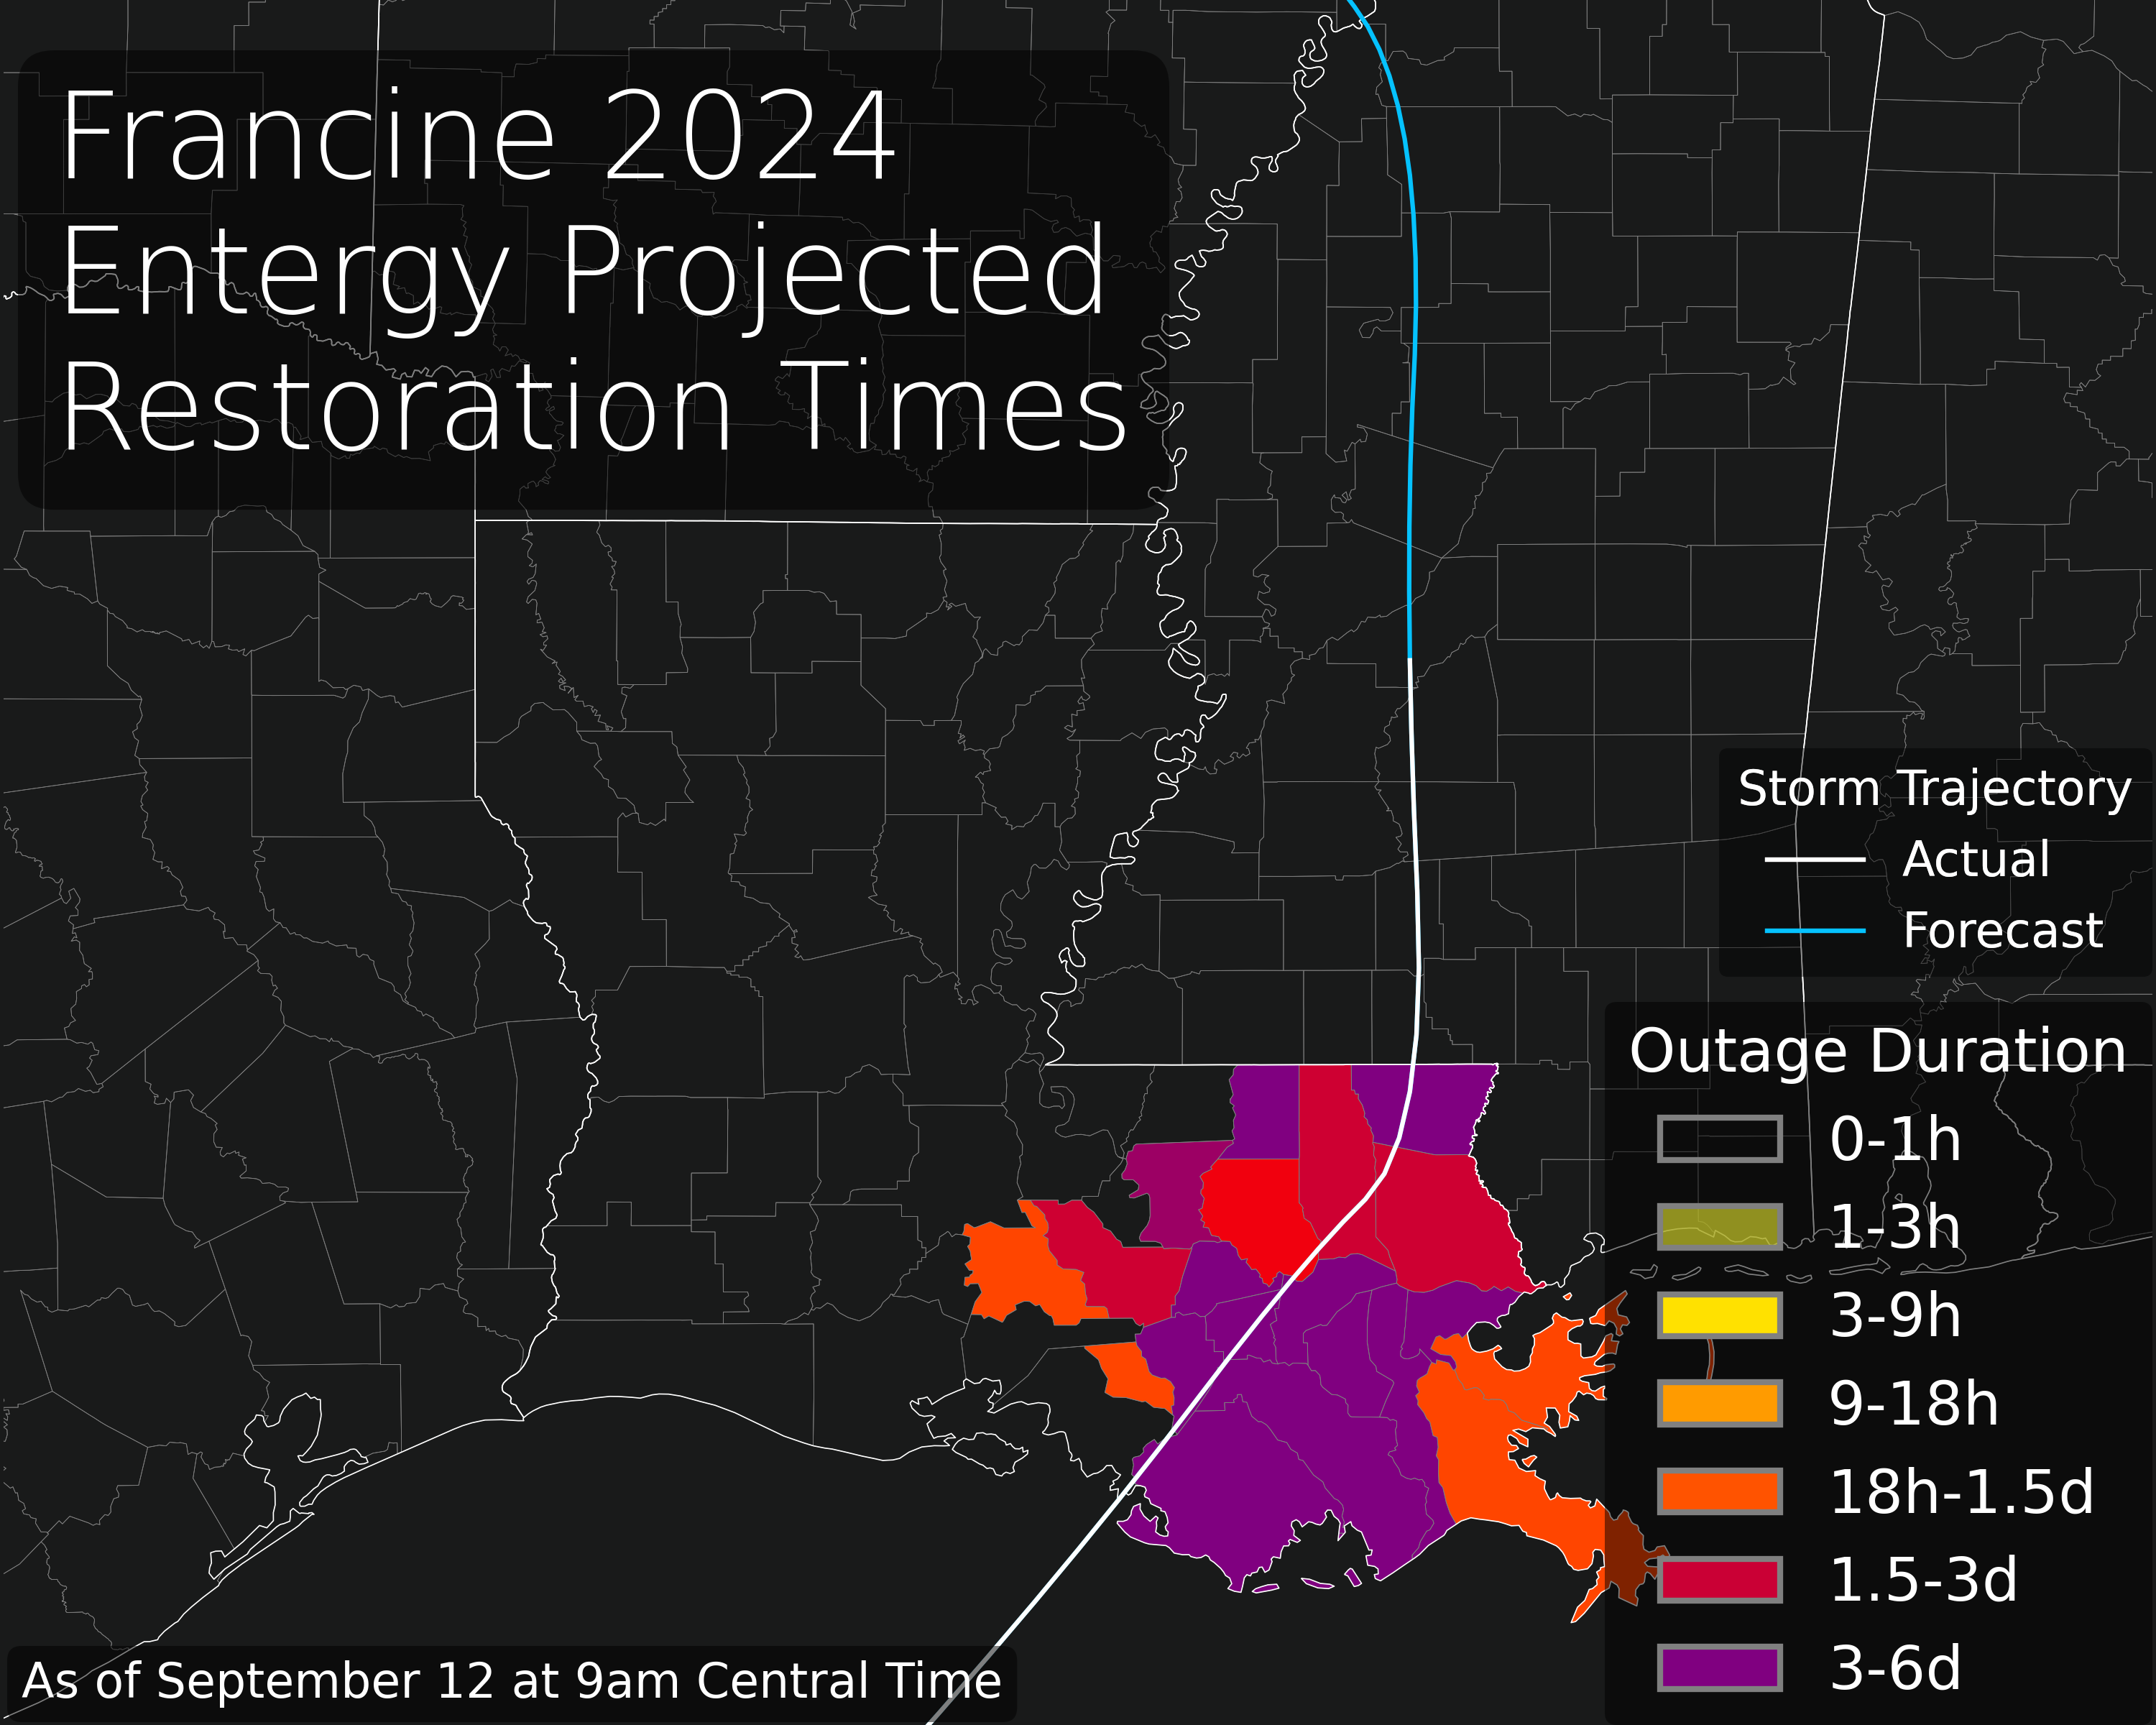 Figure 7
Hurricane Francine was on the edge between a Category 2 and a Category 1 storm when it made landfall. A few hours later, at 2:44am Wednesday September 12, approximately 300,000 Entergy customers were without power. Figure 8 is a screenshot of Entergy's outage map at the time.
Entergy's outage map shows healthy portions of the power grid as green line segments and displays red lines for areas that do not have power. Additionally, it shows extra markers when areas of particularly high density have many outages.
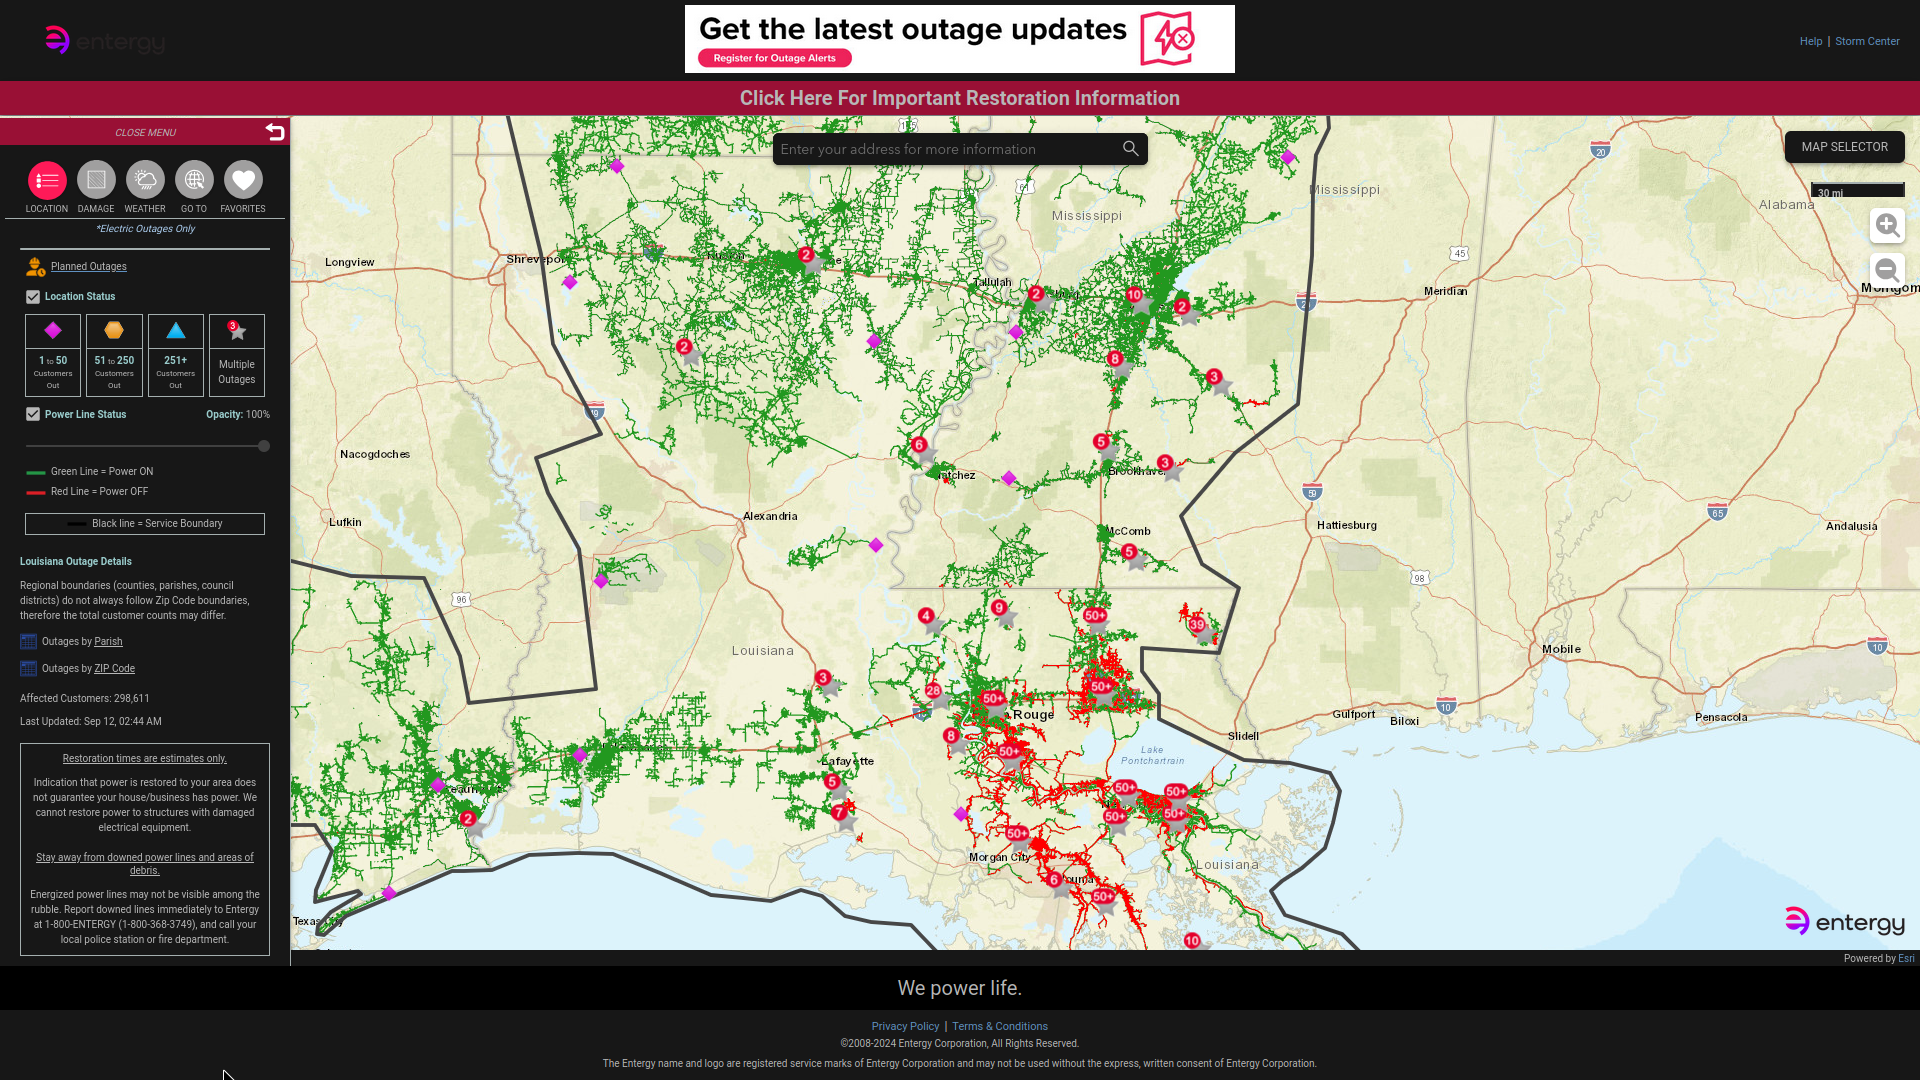 Figure 8
We at Unocity do not have ANY data from Entergy, and we have access to their public outage map only because we ourselves live in New Orleans and are customers of Entergy.
Somehow we wanted to use Entergy's outage map to get a better understanding of where and for how long power went out. So, we did what anyone would do -- we took a screenshot every few hours of the outage map.
This collection of screenshots contained all of the information we would need, but it was not packaged in a form that was particularly amenable for further analysis. Luckily, we noticed that the red areas that do not have power are pure red, and so we wrote code to detect where those pure red pixels lay on the screenshot images. Figure 9 shows the locations of pure red dots corresponding to Figure 8's outage map.
 Figure 9
The collection of outage maps has a corresponding collection of red-dot images, and each of those was taken at known times, and so we were able to determine how long each location was without power. Those actual outage durations are shown in Figure 10.
Notice that the distribution of colors is a soupy mess. There is no real way to know exactly what will happen in a storm, and the messiness of this plot is a reflection of that.
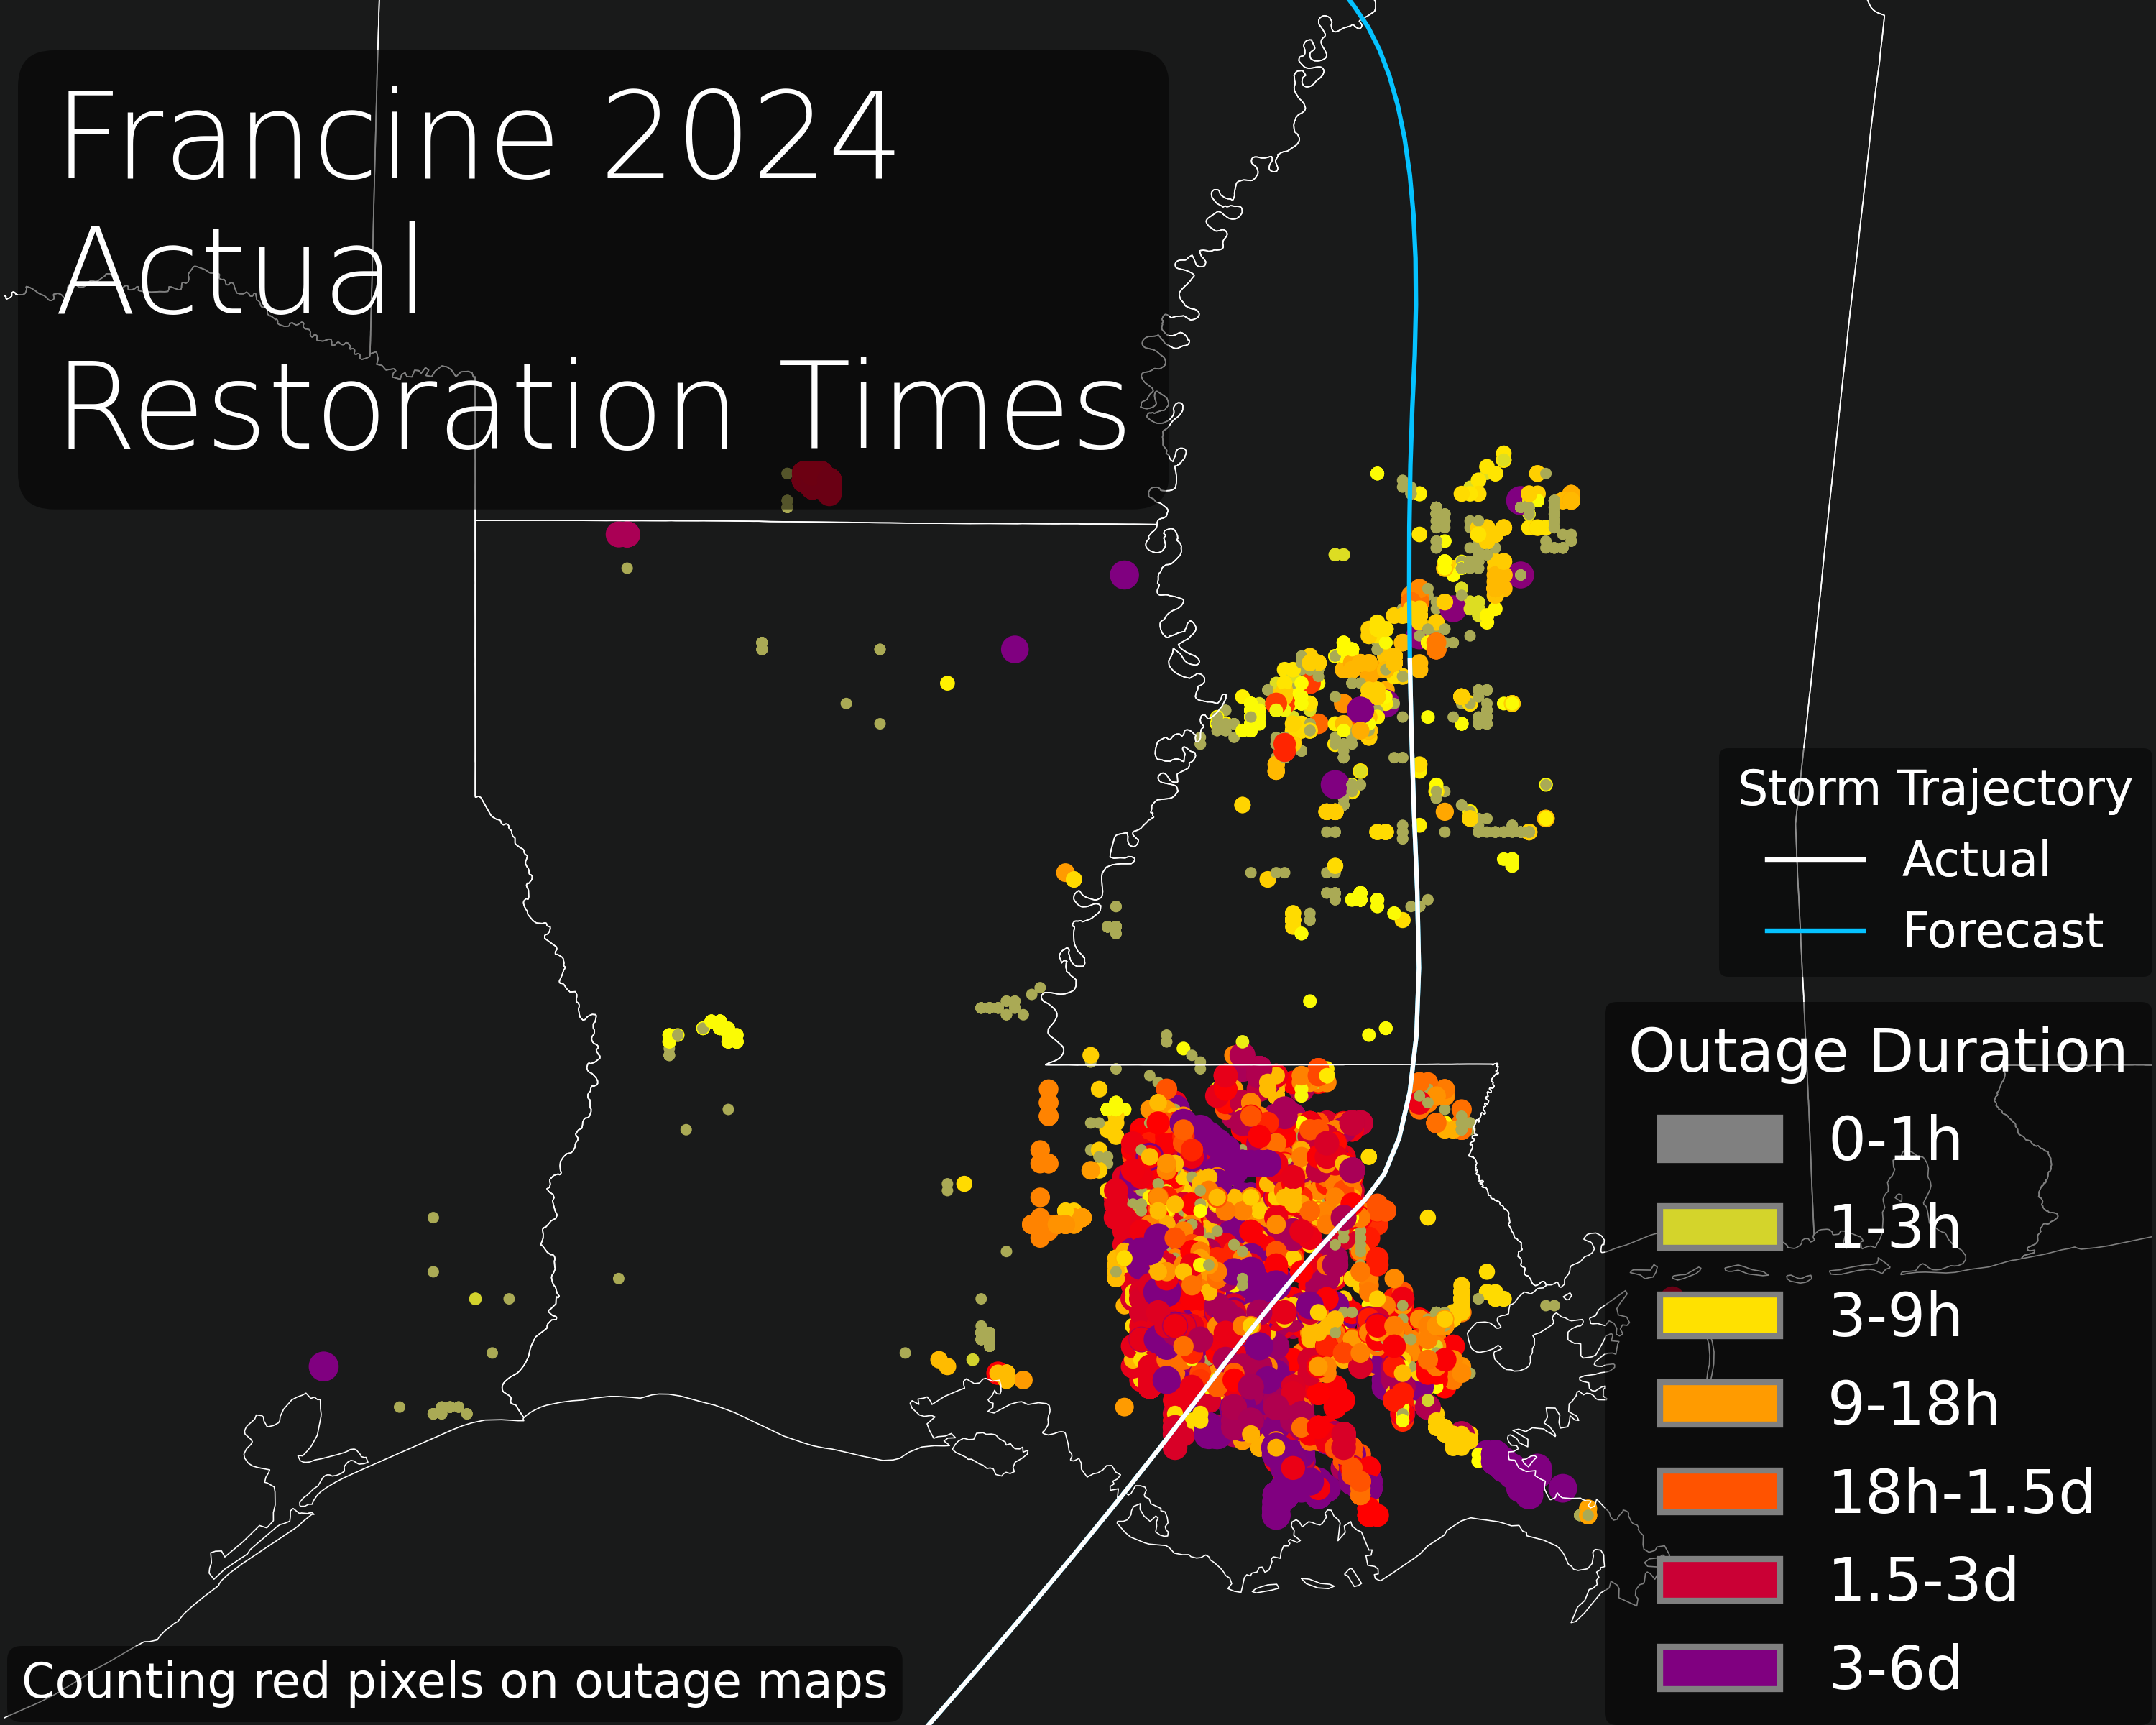 Figure 10
In order to make more sense out of the raw outage durations, we aggregated all of the outages by parish. Figure 11 is the summary that displays those actual outages at the parish level, and we again relied on the time of 90% restoration for the displayed outage durations.
This map, while imperfect in many ways, is good enough for us to assess the accuracies of our and Entergy's outage duration predictions, especially considering the fact that we do not have ANY data from Entergy.
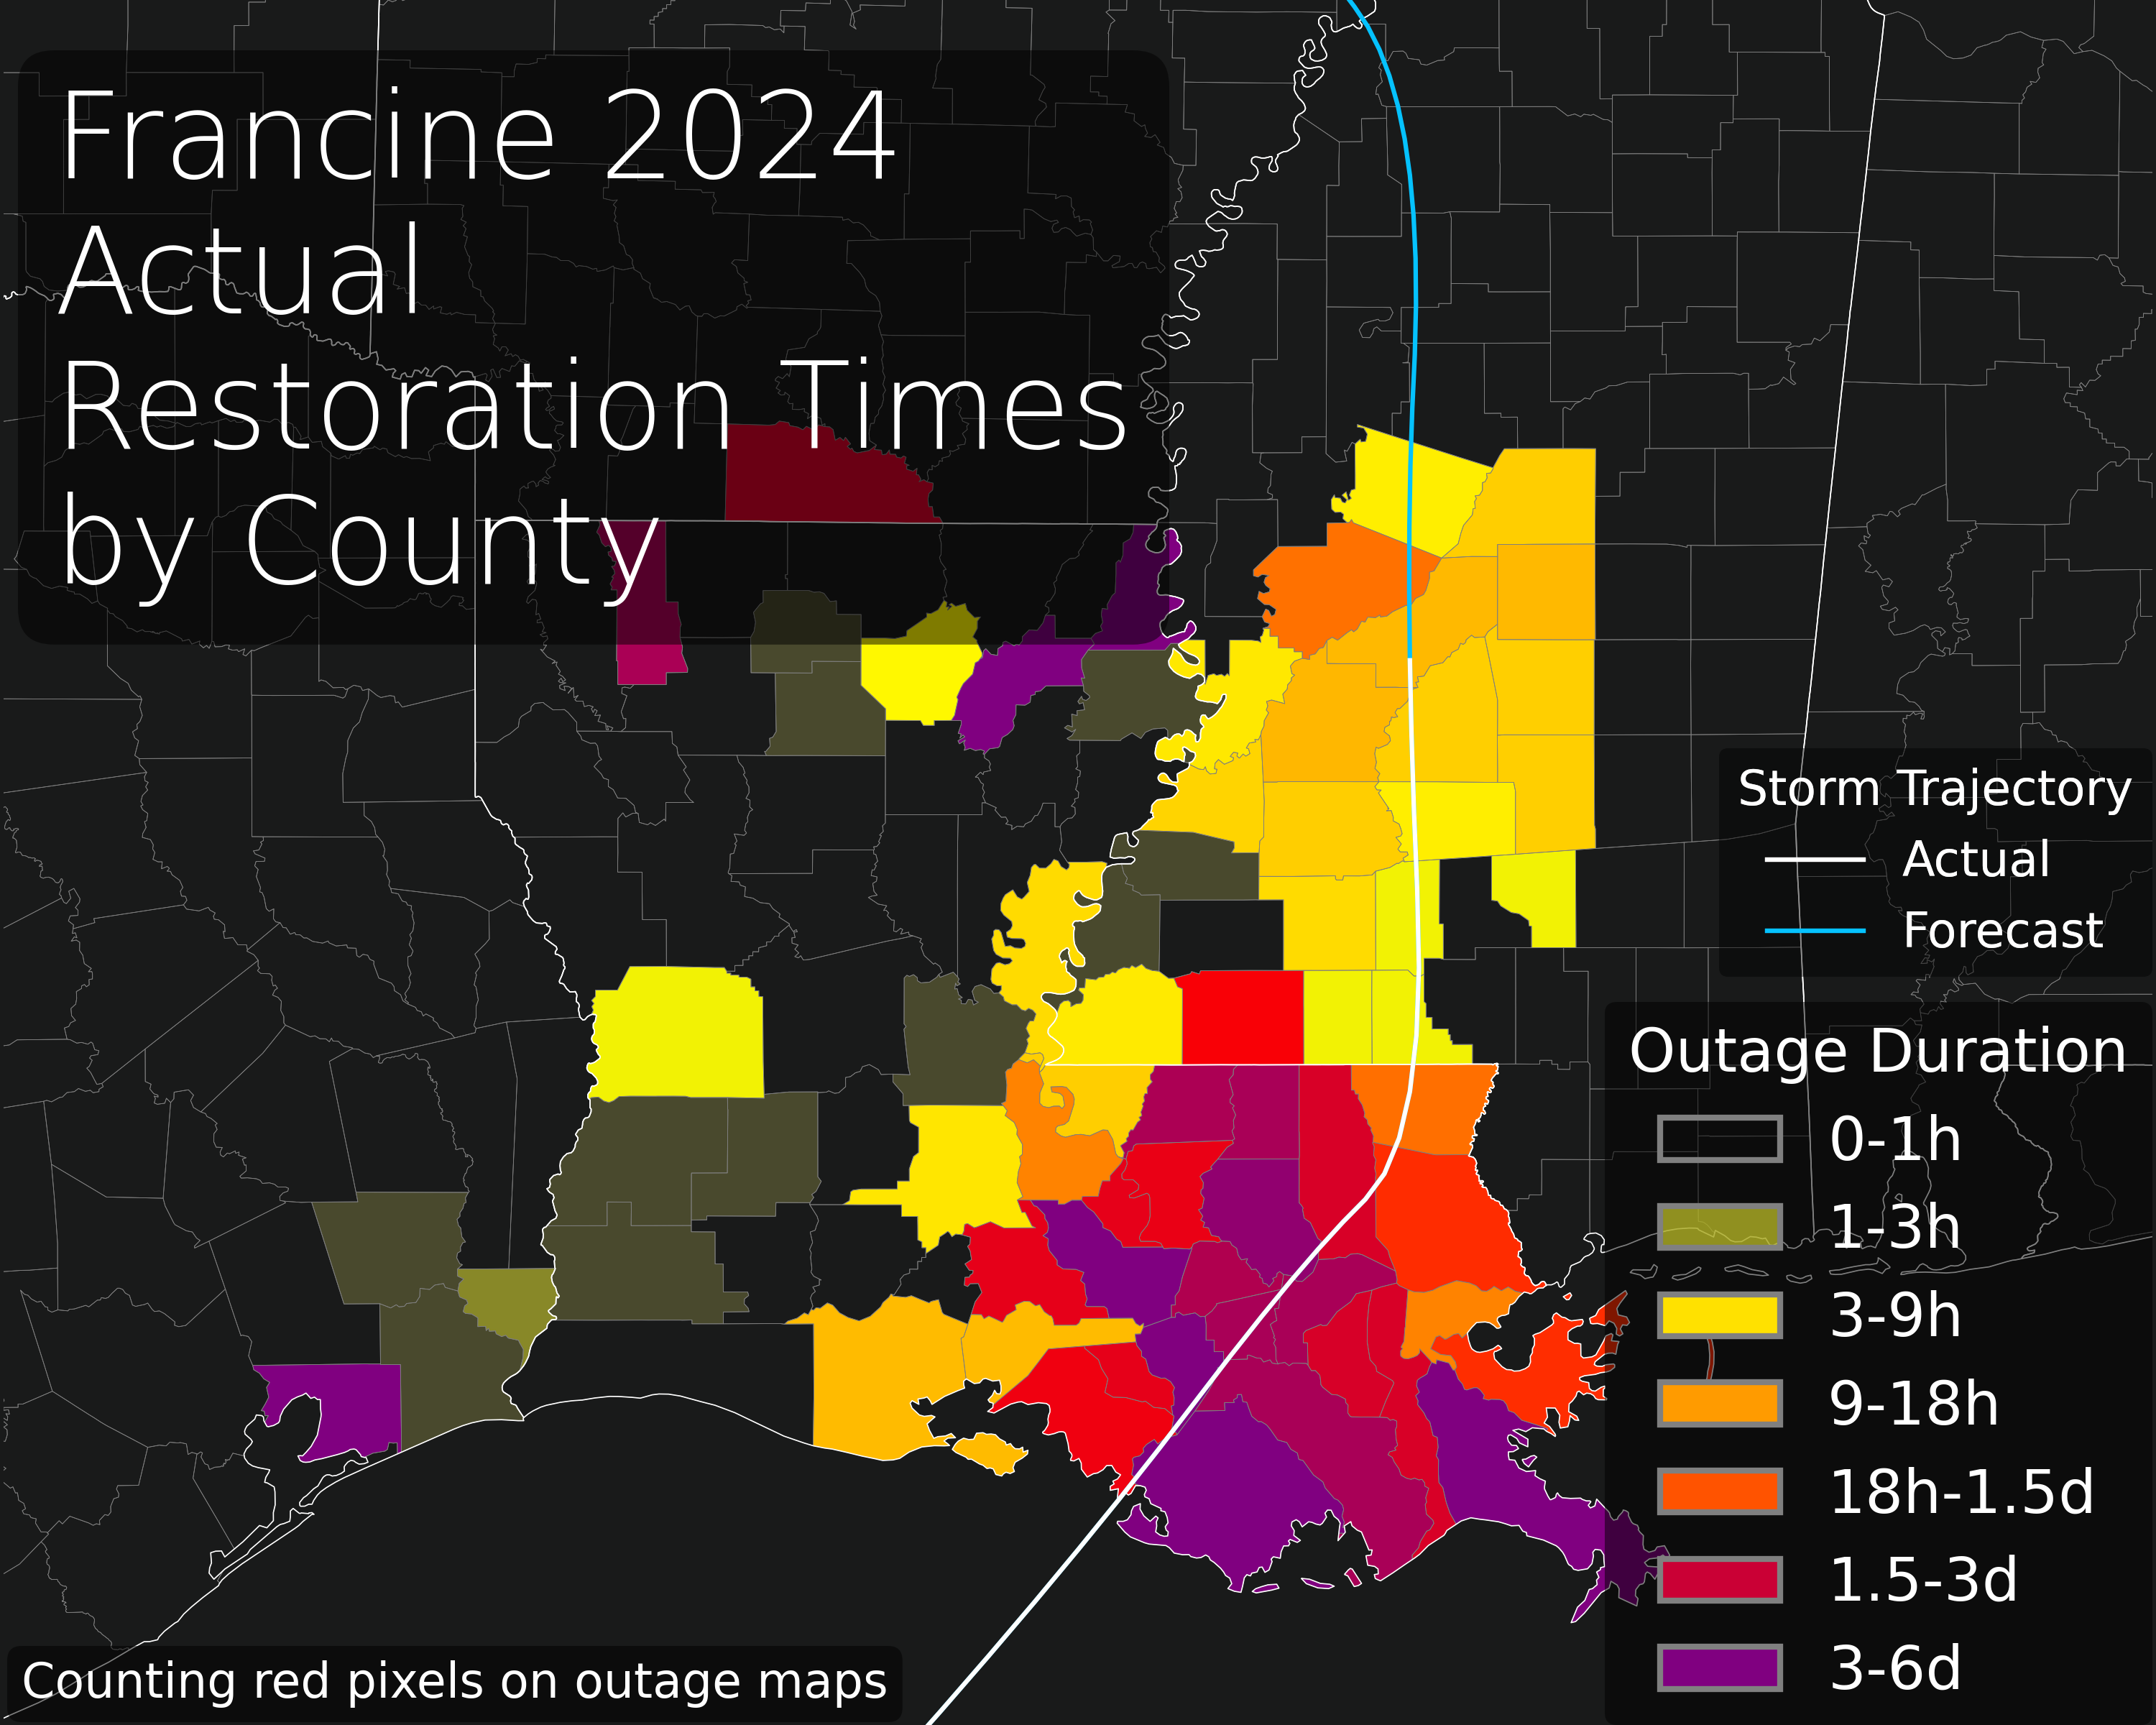 Figure 11
HurrD made its system-wide predictions public at 10:02pm Wednesday September 11 corresponding to NOAA's forecast advisory #14. This link goes to HurrD's facebook page which serves as an arbiter of truth regarding the timestamp. The image itself was shown in Figure 6.
Entergy's public announcement of projected restoration times was provided at 9am Thursday September 12. Refer back to Figure 7.
The actual Francine 2024 outages were plotted in Figure 11.
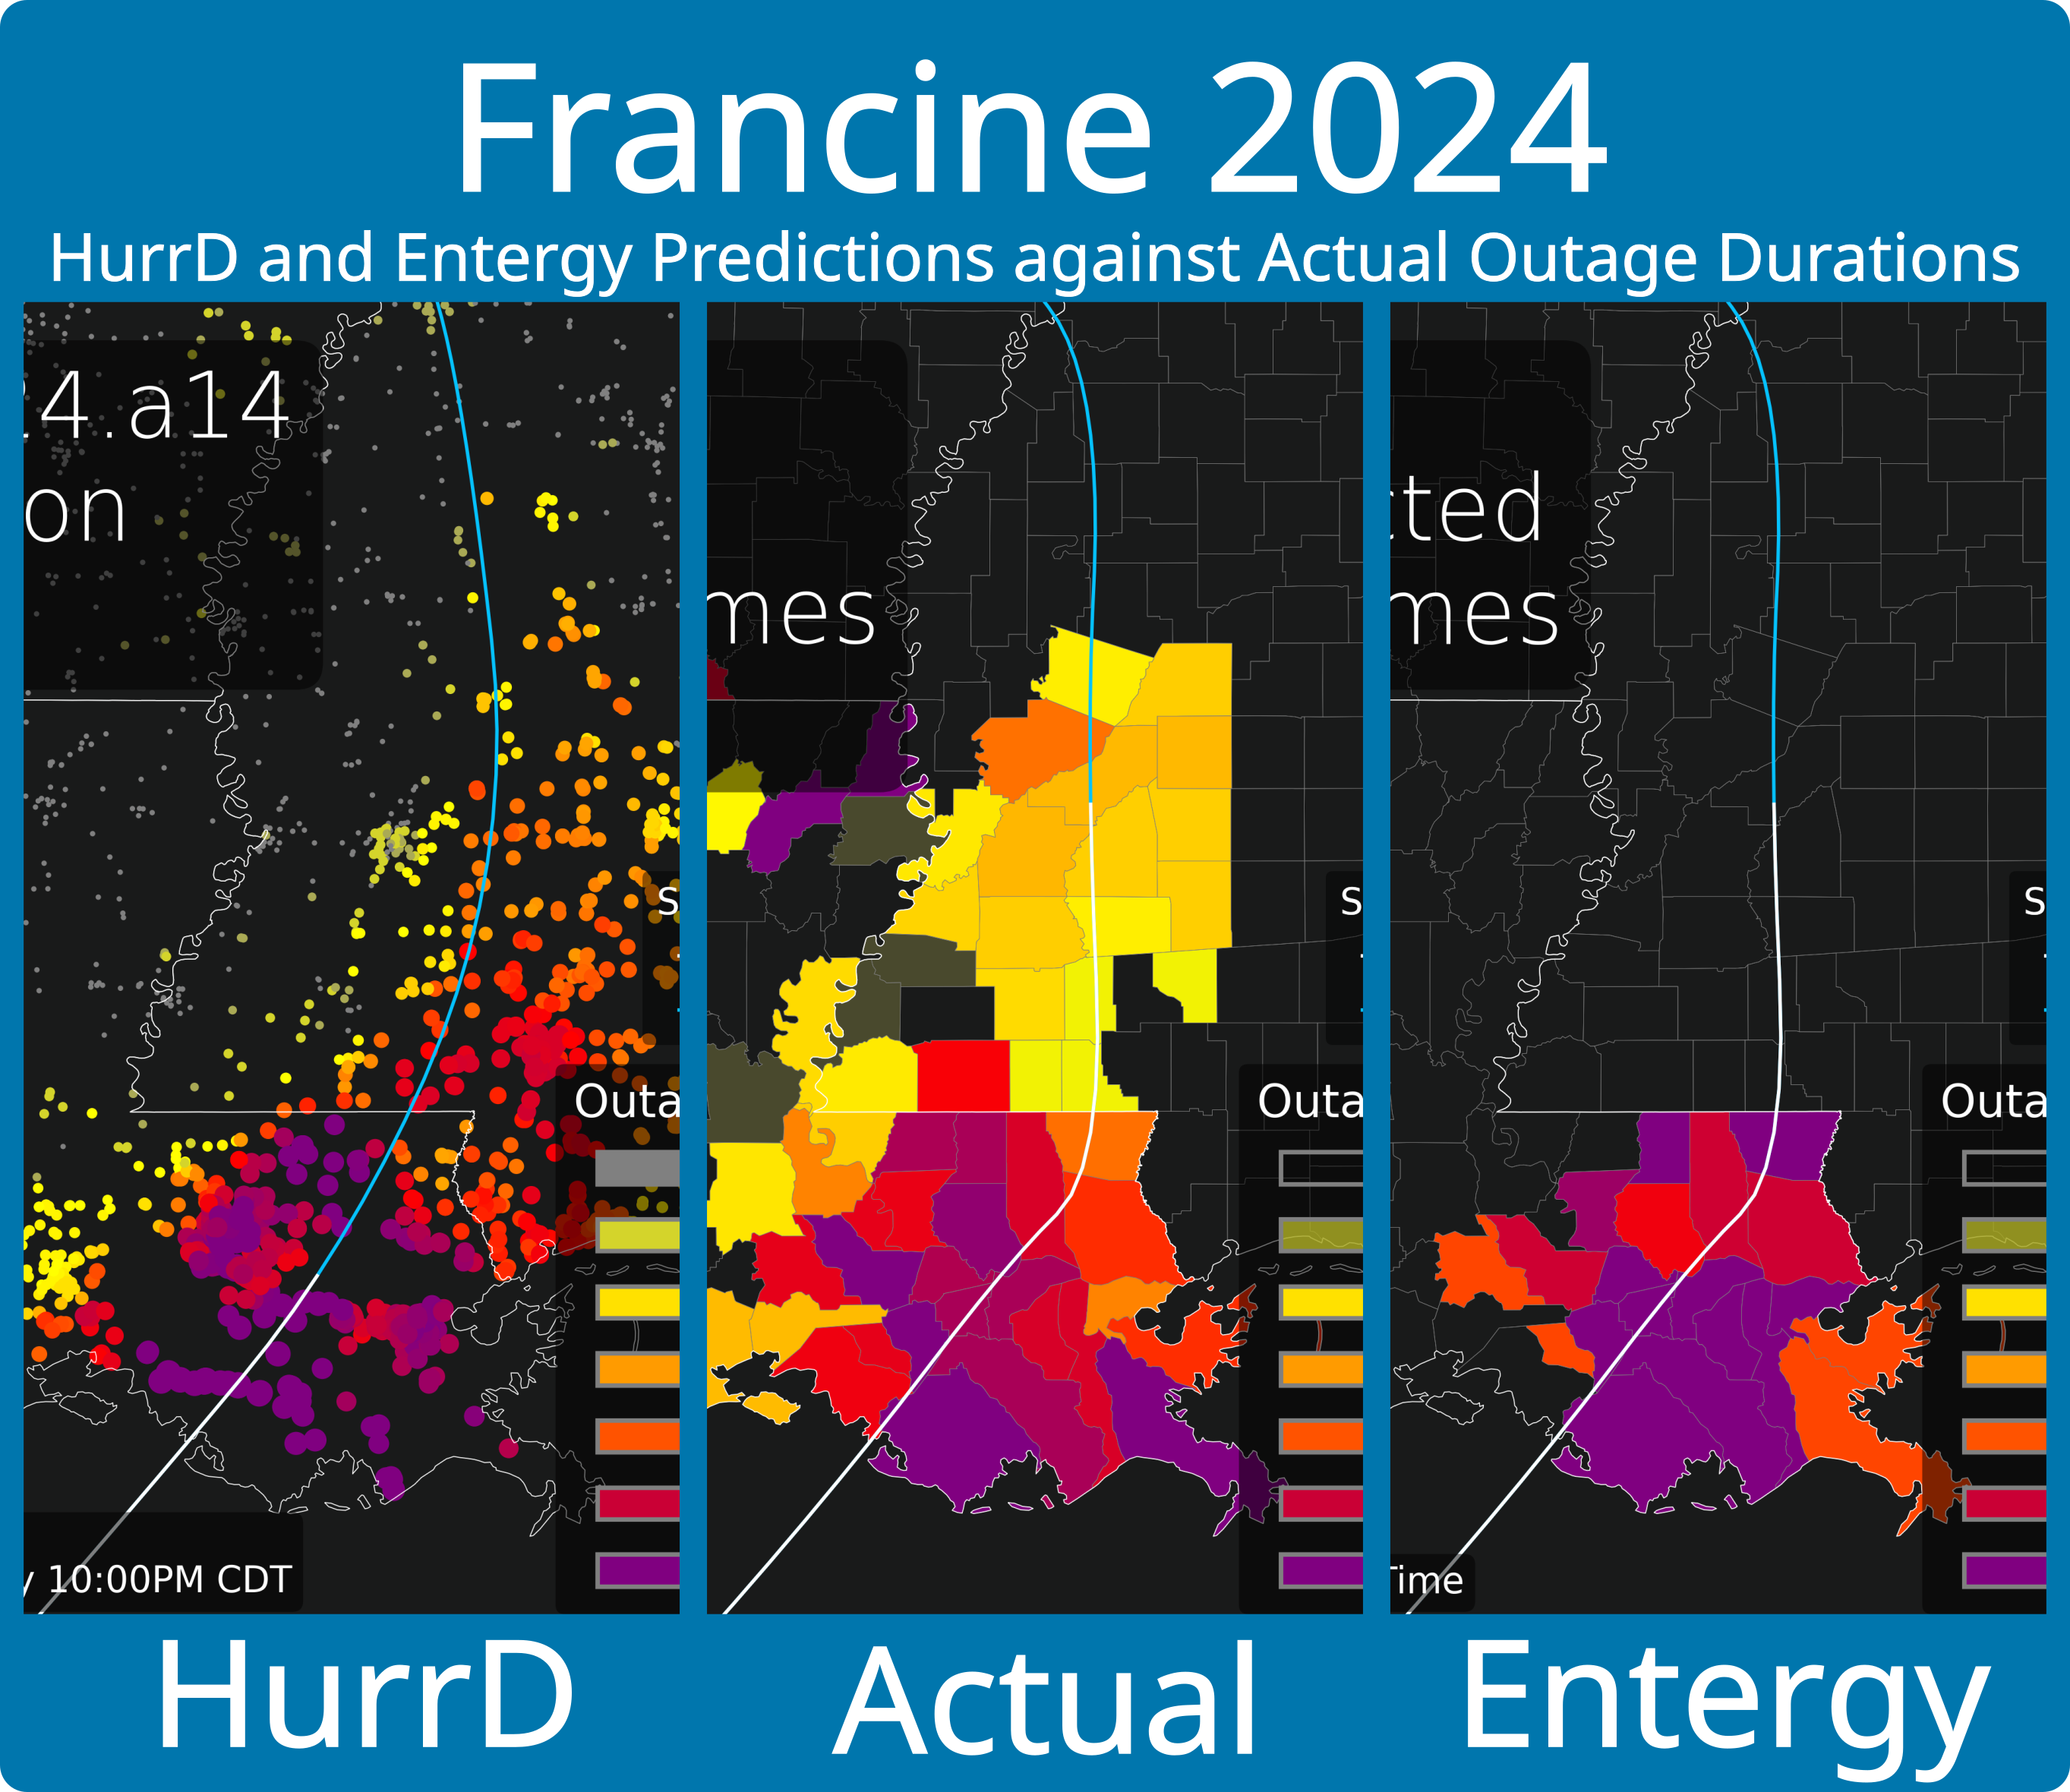
Comparing all three of these images results in Figure 12 which shows identical tight crops of the predicted outage durations given by HurrD (left slice), the actual outage durations (center slice), and the estimated restoration times provided by Entergy (right slice).
Figure 12
To our eyes, both our predictions and Entergy's predictions appear quite consistent with one another, and both appear to match what happened in reality quite closely. Examine Figure 12 to see the accuracies of the predictions.
Remember that Entergy's estimated restoration times were released after the storm passed through Louisiana but that HurrD's final predictions were made earlier, when the storm was closer to landfall.
As described near Figure 5, HurrD's predictions were updated every time NOAA provided a new forecast advisory for the storm. HurrD's predictions are dependent on NOAA forecasts, and after advisory #8 for Francine, NOAA's forecasts (and therefore HurrD's predictions) became relatively consistent. Advisory #8 was released at 10am Tuesday September 10, approximately 30 hours before the storm made landfall and approximately 48 hours before Entergy's predictions were made public.
Having outage duration predictions 30 hours in advance is powerful and allows for informed decision making. But HurrD also has two other powerful features: 1) HurrD works anywhere in the continental United States, and 2) HurrD can play What-If scenarios. The what-if scenarios in particular are useful for decision-making, as we can find out what would happen if a storm went, for example, farther east than predicted. When Francine was 72 hours away from landfall, a concerned resident of New Orleans could simply run a what-if scenario to see what would happen if the storm went through New Orleans (like it eventually did) rather than through western Louisiana where its path was forecast at the time.
Going forward, we expect NOAA's storm modeling and forecasts to become increasingly accurate. We also expect HurrD's predictions to become more accurate as storms strike the US and test the electric grid in varying locations. HurrD's Francine predictions were very good, but there always is room for improvement.
We constantly update HurrD's models and incorporate new storm data after every hurricane season. In 2024, there were several impactful hurricanes, including Beryl, Helene, Milton, and others. We will certainly use those storms' data to strengthen HurrD's predictive models, and we also have plans to analyze HurrD's timestamped public predictions that were made while they were active.
HurrD is available today with annual one-site, two-site, or three-site subscriptions. And check out our Facebook page in times of active storms. The system-wide predictions were posted there within minutes of NOAA's forecast update releases.
----------
This article originally appeared at https://unocity.us/blog/hurrd-does-it-work-and-2024-updates on December 1, 2024.
Visit https://hurrd.ai for more details on HurrD and https://unocity.us to see Unocity's main website.
